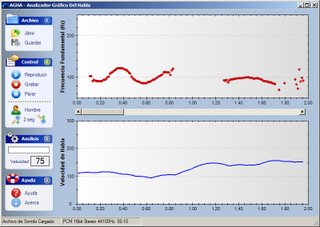
 Phew, I'm starting to finish off some side projects. Yesterday I made the finishing touches on a speech analyzer program meant as an accompanying tool for a set of oratory courses in Spanish. It's programmed in .NET and makes some beautiful real-time plots of voice frequency (pitch) and speech rate. Some technical details: real-time pitch estimation was done by Noll's algorithm, real-time speech rate estimation was a mix between enrate and a newer correlation-based method. For the signal processing part we relied on the Exocortex.DSP FFT library, and for the graphics we used the ZedGraph classes.
Good. One for the archive.
2 comments:
I am trying to use Exocortex to extract the pitch (fundamental frequency) of a wav file. The wav sample is just a single tone. I am able to create a Complex array and FFT it, but how to determine pitch from the FFT'd array? Numerical Recipes in C hinted that you find the maximum absolute value of the array and the index is the pitch:
Exocortex.DSP.Fourier.FFT(cf, Exocortex.DSP.FourierDirection.Forward);
int fundamental_frequency = 0;
for (int i = 0; i < 1024; i++)
{
if ((Math.Pow(cf[i].Re, 2) + Math.Pow(cf[i].Im, 2)) > (Math.Pow(cf[fundamental_frequency].Re, 2) + Math.Pow(cf[fundamental_frequency].Im, 2)))
{
fundamental_frequency = i;
}
}
textBox1.Text += fundamental_frequency.ToString();
But these results dont make much scense.
Tnx for any help with this.
jpreston12 at hotmail.com
jeff
Hi Jeff,
I closed this project a few years ago, and I don't recall exactly what coefficients the FFT function returns. But supposing it is just an array of Fourier coefficients of length N/2, then you get the fundamental frequency by taking into account that index i in your array corresponds to frequency 2*(i-1)/fs, where fs is your sampling frequency.
If it still doesn't make sense, try plotting the entire array of absolute values of cf for a simple signal (i.e. a sine wave). You should see a very distinctive peak in the diagram.
Post a Comment